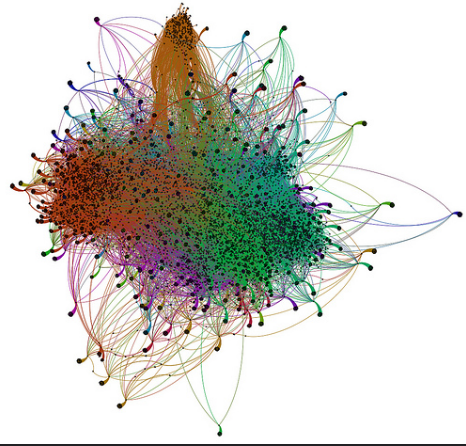
 No one would argue about the fact that the majority of the global population is now living in a time of extreme data overload and overwhelm. However, there are times when the level of statistical information that’s captured online (or stored in the cloud) can be turned into visual stories through imaginative data visualization, or merely arranged and presented in ways that are as inspiring as they are illuminating.
With so much information being absorbed visually, infographics are becoming journalistic tools that can benefit readers, businesses – and a range of web-based companies who want to inspire their audiences.
London’s annual ‘Information is Beautiful’ ceremony even offers awards for the best data visualizations and infographics from around the globe. Entering public arenas like this is just one of the many competitive ways for infographic designers to ultimately feather their commercial nests.
It’s not all about the money though. Data visualization is a supreme way for those who enjoy the online pleasure of absorbing intricately complex or simple and quirky statistics in ways that make them look at the world differently. This mini list of websites and weblogs are just a tip of the iceberg of portals that do just that.
Flowing Data
This site doesn’t just provide sparkling infographics, it’s a source for visual design tutorials, books and unconventional musings including a fast food menu of calories, Christmas movies as charts, bed sizes from around the world and marital status by age.
Information Aesthetics
An alluring site that’s been knocking around since 2004. One of the best go-tos for fusions of art, creativity and data visualization, Information Aesthetics is designed and maintained by a Belgian professor, Andrew Vande Moere. The site is a showcase for wonderfully informative graphic information on topics such as ‘Pi Visualized as a Public Urban Art Mural’ or ‘Mapping all Taxi Trips in New York in 2011’.
Junk Charts
Here’s one for conversational designers who want to get the lowdown on visual thinking from Kaiser Fung, ‘the worlds first visualization critic’. Graphics about the ABC News content, Trump and the global economy and demographic voting all come under close and entertaining scrutiny.
Revolutions
This is an excellent daily news site that provides big data science and analysis on a truly eclectic range of topics. It even has a ‘catterplots’ graph to measure the differences between households with cats or households with dogs in the USA.
Statista
The aptly-named Statista.com is essentially a portal for all manner of statistics, but has an excellent infographics page where numbers, charts and images have been applied to a broad palette of subjects. The focus on the video game industry highlights everything from the all-time best consoles to gender differences in gaming; something for all gamers to mull over if and when they opt for competitive play action by download.
It’s the ‘outside the box’ thinking, merged with patience and varied layers of design skills that’s behind the best and most inspirational visual data sites. By turning provocative facts and text into a kaleidoscope of dynamic, statistic-based shapes and images, the labyrinthine online arena is destined to keep evolving as an endless resource for innovatively presented information.
Incoming search terms:
- Airtel3G photo
- profile pic download for whatsapp

This post very helpful and useful for web site developer and in this give good information in detail that helpful. In this post explain some points in detail that helpful for people.
This is very meaningful and attractive post and I really like your thoughts and words. This is one of the best post I read your all post and I want to see your future post , Thank you so much for sharing your thought as this post.. My name is Diljeet kaur and offer some entertainment services.
Is this list based on statistics or just self-opinion? Anyways, it’s a good read and you can get lots of ideas on those websites if you run a business in the design industry.
A very well written article about website latest looks in 2017.Of course there are many different ways to go about this task, but for now we’ll just cover one of them to hit all the instructions in detail. If you follow a simple, step-by-step process, you can be up-and-running in less than an hour.
Thanks to share with us This post very helpful and useful for web site developer and in this give good information in detail that helpful.
Pretty component of content. I simply stumbled upon your website
and in accession capital to assert that I get in fact
enjoyed account your blog posts. Anyway I will be subscribing in your augment or even I success you get entry to consistently quickly.